Logistic Regression Explained in 7 Minutes.

Logistic regression is one of the most commonly used predictive models by data scientists. In this article, I will explain some of the theory behind logistic regression so that you get an intuitive understanding of how it works.
Then, I will dive into the metrics used to evaluate logistic regression models and when you should use each of them.
Finally, I will show you how to build a logistic regression model in Python using Scikit-Learn.
What is Logistic Regression?
In simple words, logistic regression is a model that predicts the probability of an event taking place. It is used to solve classification problems, which means that the dependent variable is always a class or category.
Here are some examples of classification problems that can be solved with the help of logistic regression:
- Predicting whether an email is ham or spam
- Identifying the species of an animal based on its image
- Classifying website traffic as benign or malicious
Classification problems can be divided into two types: binary and multi-class classification.
Binary classification involves predicting one of two classes (e.g. cat vs dog), and multi-class classification refers to predicting one of many classes (e.g. cat vs dog vs bear).
How Does Logistic Regression Work?
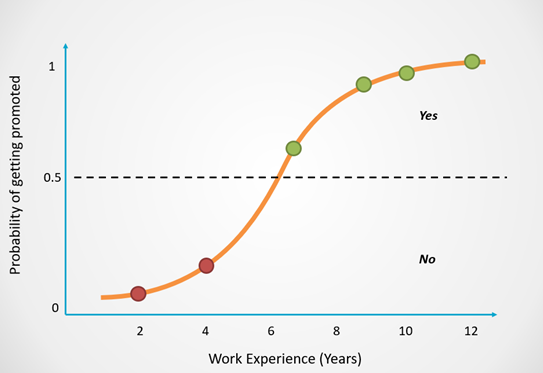
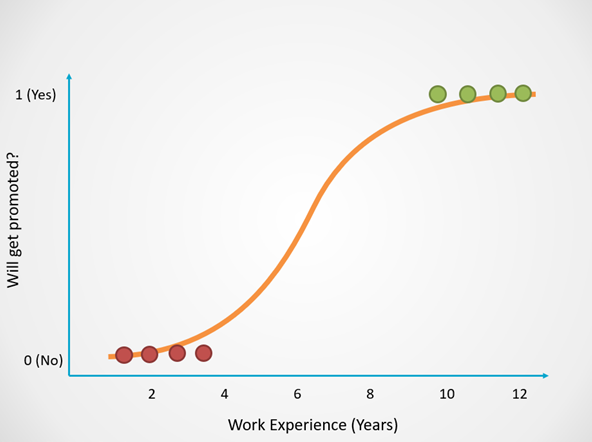
Logistic regression can be modeled with an S-shaped curve as displayed in the example below:
The X-axis of this graph displays the number of years in the company, which is the dependent variable. The Y-axis tells us the probability that a person will get promoted, and these values range from 0 to 1.
A probability of 0 indicates that the person will not get promoted and 1 tells us that they will get promoted.
Logistic regression returns an outcome of 0 (Promoted = No) for probabilities less than 0.5. A prediction of 1 (Promoted = Yes) is returned for probabilities greater than or equal to 0.5:

You can see that as an employee spends more time working in the company, their chances of getting promoted increases.
Based on the concepts explained above, you might have the following question:
Why do we need logistic regression — Why can’t we simply use a straight line to predict whether a person will get promoted?
Linear regression is a technique that is commonly used to model problems with continuous output. Here is an example of how linear regression fits a straight line to model the observed data:
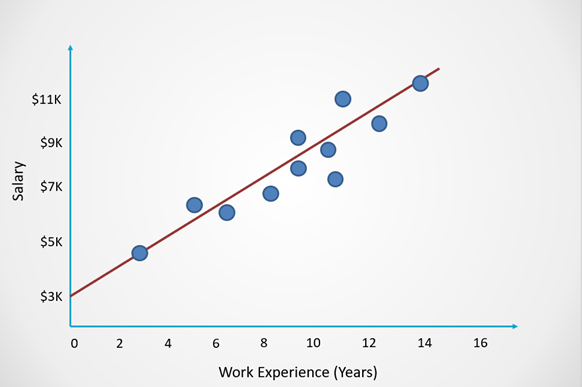
For classification problems, however, we cannot fit a straight line like this onto the data points at hand.
This is because the line of best fit in linear regression does not have an upper and lower bound, and the predictions can become negative or exceed one.
Here is an example of what it would look like if we used linear regression to model whether a person will get promoted:
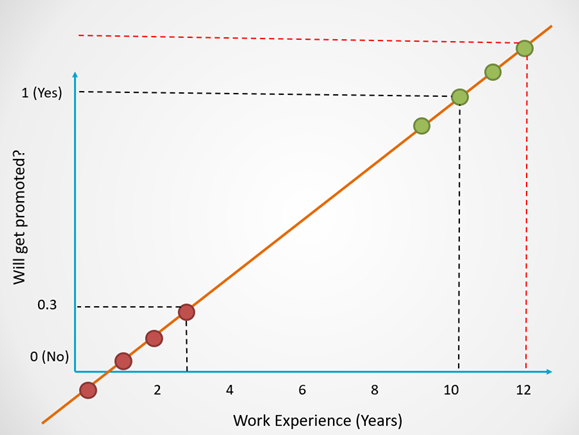
Notice that in this example, linear regression still works for certain values.
For people with 10 years of work experience, we get a prediction of 1.
For 3 years of work experience, the model predicts a probability of 0.3, which will return an outcome of 0.
However, since there is no upper bound, observe how the predictions for employees with 12 years of work experience exceed 1. Similarly, for employees with less than 1 year of work experience, the predictions become negative.
Since we want to predict a binary outcome (Yes/No), the predictions need to range from 0 to 1. It isn’t possible to have negative predictions or predictions that exceed 1.
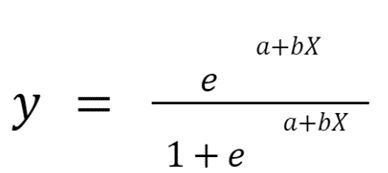
To ensure that the outcome is always a probability, logistic regression uses the sigmoid function to squash the output of linear regression between 0 and 1:
Here is the equation for linear regression, which is also the equation for a straight line:
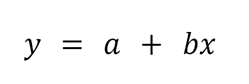
And this is the equation for logistic regression, which simply squashes the output of linear regression between 0 and 1:
Now that you understand how logistic regression works, let’s look into the different metrics used to evaluate this type of model.
How to Evaluate Logistic Regression Models?
The most popular metric used to evaluate the performance of classification models is accuracy. However, accuracy isn’t always the most reliable indicator of a good model, which is why data scientists often use measures like precision, recall, and the F1-score instead.
Here is an example to help you understand the different classification metrics and when to use them:
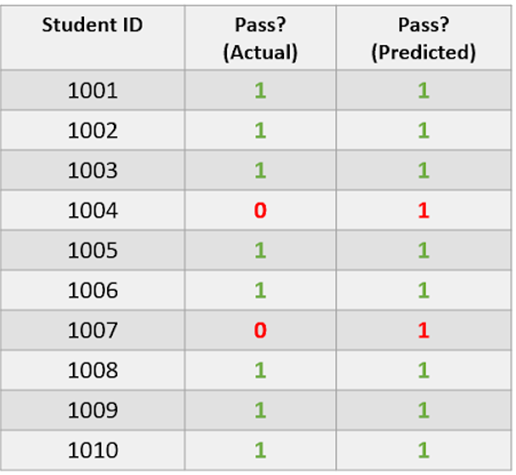
The dataset above comprises information of whether a student passed an exam. A value of 1 indicates that they passed and 0 tells us that they did not.
The “Actual” column comprises true data while the “Predicted” column contains the predictions of a logistic regression model.
The true data is imbalanced since 80% of students passed and 20% failed. This means that the dataset is skewed to represent more of one class than another.
Now, take a look at the “Predicted” column. Notice that the model has predicted that 100% of students passed. This model is only predicting the majority class, so it is a poor model.
Let us now calculate a few classification metrics on this dataset:
Accuracy
Accuracy is calculated using the following formula:
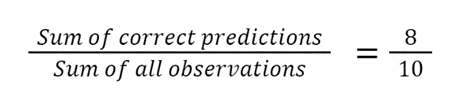
This model has an 80% accuracy. However, as we noted earlier, the model has only predicted one class, and has not even made one accurate positive prediction.
Although its accuracy is high, the model has performed poorly. Accuracy can be a misleading metric in this case, since it can leave data scientists with the assumption that their model is good even when that is not the case.
Let’s now look at a few other metrics that can help us overcome the drawbacks of accuracy.
Precision and Recall
Precision and recall are two metrics used to assess the quality of positive predictions made by the model.
Now, let’s look further into precision and recall and how to calculate them:
1. Precision
Precision is a measure that can tell us: out of all the positive predictions, how many students actually passed?
It is calculated using the following formula:
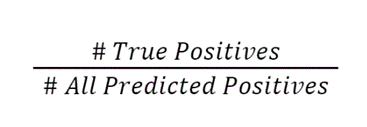
In this case, the classifier’s precision is 0/0 = 0.
2. Recall
A model’s recall can tell us: out of everyone who passed, how many of them were correctly identified?
The formula to calculate recall is:
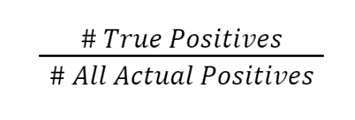
In this case, the classifier’s recall is 0/2 = 0.
F1-Score
The F1-score combines the precision and recall value and gives us a single outcome.
In simple words, this metric tells us how well a model is performing by taking the average of its precision and recall.
The formula to calculate the F1-score is:
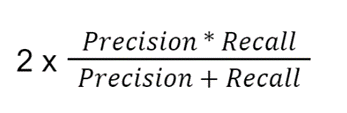
In this case, the classifier’s F1 score is 2 X 0= 0.
Summary
To summarize, this model’s accuracy is high but its precision, recall and F1-score are 0 because it did not make any positive predictions.
The main takeaway from this section is that while accuracy is often used to evaluate the performance of logistic regression models, it is important to calculate other measures as well to ensure that your model really is performing well.
I did not dive too deep into any of these metrics since the focus of this article is on logistic regression. If you want a deeper understanding of how precision and recall work, along with how to answer interview questions about them, read my tutorial on the topic.
How to Perform Logistic Regression in Python?
You can run the following lines of code to build a logistic regression model using Scikit-Learn:
from sklearn.linear_model import LogisticRegression
lr = LogisticRegression()
lr.fit(X_train,y_train) # train the model
preds = lr.predict(X_test) # make predictions